EagleStone Wealth Advisors, Inc. is in the process of withdrawing its registration with the SEC and is no longer taking on any new clients. EagleStone Tax & Wealth Advisors has merged with Onyx Bridge Wealth Group, Onyx Bridge Tax Group, and Onyx Bridge Retirement Group, respectively. You will be redirected to their site in the next 5 seconds.
The Markets (second quarter through September 29, 2023)
The positive momentum of the first two quarters of the year did not carry over to the third quarter. Inflation continued to prove stubborn throughout the third quarter, moderating somewhat, but not enough to curb the Federal Reserve’s hawkish monetary policy. Crude oil and gasoline prices soared during the summer. Job gains, while steady, declined throughout the third quarter. The housing sector slowed on rising mortgage rates and dwindling inventory. The third quarter saw most of the market sectors decline from the second quarter. Utilities, real estate, information technology, consumer staples, and consumer discretionary fell the furthest, while energy rose by more than 16.0%.
On the last day of the third quarter, each of the benchmark indexes lost value compared to their second quarter performances. The small caps of the Russell 2000, sensitive to current economic changes, fell the furthest, followed by the Nasdaq, the S&P 500, the Global Dow, and the Dow. Rising interest rates have impacted bond prices, yields, and the U.S. dollar. Ten-year Government bond yields rose in the third quarter, reaching the highest level since 2007, as long-term bond prices slid lower. The U.S. dollar also rose in the third quarter, hitting its highest level since last November. With rising bond yields, foreign investors buy dollars to buy bonds, which helps contribute to the increasing dollar. The increase in the Federal Funds rate pushed mortgage rates to 7.31% on the benchmark 30-year home loan, the highest rate in 23 years. However, unlike 2000, house prices are generally rising alongside mortgage rates, as demand has outpaced available inventory. Oil prices, near $91.00 per barrel, rose nearly 30.0% since June, as Saudi Arabia and Russia, the world’s second and third largest oil exporters, extended voluntary restrictions on their production. The retail price for regular gasoline was $3.837 per gallon on September 25, $0.024 above the August 28 price and $0.027 higher than the price on June 26. Regular retail gas prices increased $0.126 from a year ago. Gold prices declined in the third quarter, nearing a seven-month low.
July began the quarter with stocks posting notable gains from the previous month. Economic indicators offered signs that inflation was moderating, which helped equities advance. The S&P 500 notched its fifth consecutive monthly gain as all 11 market sectors finished the month higher. Overall, small caps outperformed large caps, with the Russell 2000 (6.1%) leading the benchmark indexes listed here. Energy stocks jumped higher on the heels of rising crude oil prices, which hit a three-month high. Ten-year Treasury yields rose above 4.00% during the month, only to retreat somewhat to 3.95% by the end of July. According to data released in July, both the Consumer Price Index (CPI) and the personal consumption expenditures (PCE) price index rose 0.2% in June compared to a 0.3% advance in May. Adding further evidence of potentially waning inflation, the PCE price index was up 4.1% from June 2022, the lowest 12-month reading since September 2021. Despite slowing inflation, the Federal Reserve opted to hike interest rate 25.0 basis points at the end of July, although there were expectations that the Fed may end interest rate increases. The initial estimate of gross domestic product showed the economy expanded at an annualized rate of 2.4% in the second quarter compared to a 2.0% advance in the first quarter. Consumer spending in the second quarter slowed to 1.6%, down from 4.2% in the first quarter. Employment began to show signs of slowing as job gains in July (157,000) were below the June total (187,000).
Stocks tumbled in August. Each of the benchmark indexes listed here lost value, with the S&P 500 suffering a losing month for the first time since February. The small caps of the Russell 2000 declined more than 5.0%, while the Nasdaq, the Dow, the Global Dow, and the S&P 500 slid more than 2.0%. Long-term bond prices declined, driving yields higher. Ten-year Treasury yields ended the month at 4.1%, up nearly 14.0 basis points from July. Several economic indicators released in August showed favorable results. Industrial production rose 1.0% in July after declining in both May and June. Consumer spending increased 0.8%, while retail sales jumped 0.7%. The PCE price index and the CPI rose 0.2%. While sales of existing homes declined, new home sales rose to their highest level since early 2022 despite soaring mortgage rates. Unfortunately, investors seemed to view August’s moderately favorable economic news as a sign that the Federal Reserve would maintain its aggressive monetary policy. The result was a move away from stocks. With the exception of energy, the remaining market sectors declined. Crude oil prices rose more than 2.0%, as production cuts from Saudi Arabia and Russia drove prices higher.
September continued the bear run for stocks. Each of the benchmark indexes listed here fell between 3.0% and more than 6.0%. Inflationary pressures showed signs of cooling, with core prices for the PCE price index and the CPI decreasing for the 12-months ended in August. The Federal Reserve elected not to increase interest rates in June, opting, instead, to step back and assess additional information and its implications for monetary policy. Gross domestic product advanced at an annualized rate of 2.1%, according to the third and final estimate. Crude oil prices continued to increase as did the yield on 10-year Treasuries. Gold prices declined more than 5.0%.
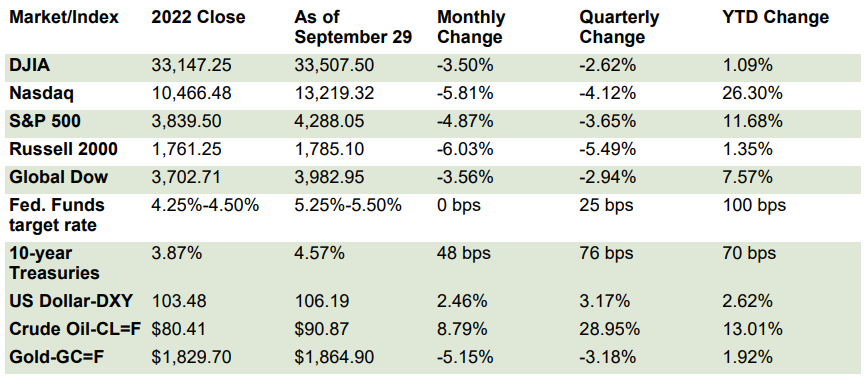
Chart reflects price changes, not total return. Because it does not include dividends or splits, it should not be used to benchmark performance of specific investments.
Latest Economic Reports
Employment: Employment rose by 187,000 in August from July following a downwardly revised July total of 157,000. Over the last 12 months ended in August, the average monthly job gain was 312,000. In August, employment trended upward in health care, leisure and hospitality, social assistance, and construction. The unemployment rate increased 0.3 percentage point for the second straight month to 3.8%. In August, the number of unemployed persons rose by 514,000 to 6.4 million. The employment-population ratio was unchanged at 60.4%, while the labor force participation rate advanced 0.2 percentage point to 62.8%. In August, average hourly earnings increased by $0.08, or 0.2%, to $33.82. Over the 12 months ended in August, average hourly earnings rose by 4.3%. In August, the average workweek edged up 0.1 hour to 34.4 hours.
There were 204,000 initial claims for unemployment insurance for the week ended September 23, 2023. The total number of workers receiving unemployment insurance was 1,670,000. By comparison, over the same period last year, there were 182,000 initial claims for unemployment insurance, and the total number of claims paid was 1,290,000.
FOMC/interest rates: The Federal Open Market Committee left the Federal Funds target rate unchanged following its meeting in September. However, it is anticipated that one more 25-basis point increase will occur before the end of the year. In addition, Fed Chair Jerome Powell indicated that inflation was still elevated and that interest rates would likely remain higher for a longer period than previously projected.
GDP/budget: Economic growth remained steady in the second quarter, as gross domestic product increased 2.1%, compared with a 2.2% increase in the first quarter. The deceleration in second-quarter GDP compared to the previous quarter primarily reflected a smaller decrease in consumer spending, a downturn in exports, and a deceleration in federal government spending. These movements were partly offset by an increase in private inventory investment and in nonresidential fixed investment, coupled with a smaller decrease in residential investment. Imports turned down. Consumer spending, as measured by personal consumption expenditures, rose 0.8% in the second quarter compared to a 3.8% increase in the first quarter. Consumer spending on long-lasting durable goods inched down 0.3% in the second quarter after advancing 14.0% in the prior quarter. Spending on services rose 1.0% in the second quarter (3.1% in the first quarter). Nonresidential fixed investment increased 7.4% after rising 5.7% in the first quarter. Residential fixed investment fell 2.2% in the second quarter, lower than the decrease in the first quarter (-5.3%). Exports decreased 9.3% in the second quarter following an increase of 6.8% in the first quarter. Imports, which are a negative in the calculation of GDP, decreased 7.6% in the second quarter after advancing 1.3% in the previous quarter. Consumer prices increased 2.5% in the second quarter compared to a 4.2% advance in the first quarter. Excluding food and energy, consumer prices advanced 3.7% in the second quarter (5.0% in the first quarter).
The federal budget had a surplus of $89.0 billion in August but a deficit of $1,524 billion through the first 11 months of fiscal year 2023. By comparison, the August 2022 monthly deficit was $220.0 billion and the total deficit through August 2022 was $946.0 billion. In August, government receipts totaled $283.0 billion, while outlays equaled $194.0 billion. Compared to the first 11 months of the prior fiscal year, government outlays increased by $142.0 billion, while receipts rose by $438.0 billion.
Inflation/consumer spending: According to the latest Personal Income and Outlays report, consumer spending increased 0.4% in August, down from 0.9% (revised) in July. Personal income rose 0.4% in August, while disposable personal income inched up 0.2%. Rising prices at the pump pushed consumer prices higher in August. Consumer prices rose 0.4% in August, 0.2 percentage point above the July estimate. Consumer prices excluding food and energy (core prices), the preferred inflation indicator used by the Federal Reserve, edged up only 0.1% in August, down from the July increase of 0.2%. Over the 12 months ended in August, consumer prices increased 3.5%, 0.2 percentage point above the rate for the period ended in July. Core prices rose 3.9% for the year ended in August, down from 4.3% for the 12 months ended in July.
The Consumer Price Index rose 0.6% in August compared to a 0.2% advance in July. Over the 12 months ended in August, the CPI advanced 3.7%, up 0.5 basis point from the annual rate for the period ended in July. Core prices, excluding food and energy, rose 0.3% in August and 4.3% over the last 12 months, which is the lowest 12-month rate since September 2021. Energy prices rose 5.6% in August with gasoline prices increasing 10.6%, which accounted for over half of the overall CPI increase. However, energy prices are down 3.6% since August 2022. Food prices advanced 0.2% in August, matching the July increase. Since August 2022, food prices rose 4.3%. Prices for shelter advanced 0.8% in August and 7.3% over the last 12 months.
Prices that producers received for goods and services increased 0.7% in August after rising 0.3% in July. Producer prices increased 1.6% for the 12 months ended in August, double the 12-month increase from July 2022. The August advance was the largest monthly advance since June 2022. In August, 80.0% of the overall increase in producer prices was attributable to a 2.0% jump in prices for goods. Prices for services advanced 0.2%. Producer prices less foods, energy, and trade services increased 0.3% in August, the same as in July. For the 12 months ended in August, prices less foods, energy, and trade services rose 3.0%, the largest advance since moving up 3.4% for the 12 months ended in April.
Housing: Sales of existing homes decreased 0.7% in August, marking the third consecutive month of declines. Since August 2022, existing-home sales dropped 15.3%. According to the report from the National Association of Realtors®, two factors have stifled sales activity: rising mortgage rates and limited inventory. In August, total existing-home inventory sat at a 3.3-month supply at the current sales pace, unchanged from the previous month. The median existing-home price was $407,100 in August, up from the July price of $405,700 and well above the August 2022 price of $391,700. Despite a drop in the number of sales, home prices continue to rise. Prices will likely remain elevated until inventory increases. Sales of existing single-family homes dropped 1.4% in August and 15.3% from a year ago. The median existing single-family home price was $413,500 in August, up from the July price of $411,200 and above the August 2022 price of $398,800.
New single-family home sales declined in August, falling 8.7% from the July estimate. Overall, single-family home sales were up 5.8% from a year earlier. The median sales price of new single-family houses sold in August was $430,300 ($436,600 in July). The August average sales price was $514,000 ($507,900 in July). The inventory of new single-family homes for sale in August increased to 7.8 months, up from 7.0 months in July.
Manufacturing: Industrial production advanced 0.4% in August after advancing 0.7% in July. Manufacturing inched up 0.1% in August, held back by a drop of 5.0% in the output of motor vehicles and parts. Excluding that sector, factory output rose 0.6%. In August, mining moved up 1.4%, while utilities increased 0.9%. Total industrial production in August was 0.2% above its year-earlier level. In August, the aforementioned drop in the output of motor vehicles and parts contributed to declines in the indexes for consumer durables and transit equipment. Most of the other major market groups posted increases in August. The index for consumer nondurables moved up 0.4%, and the index for materials advanced 0.7%. Within materials, energy materials rose 1.5%, while nonenergy materials edged up 0.1%.
New orders for durable goods rose 0.2% in August, marking the fifth monthly increase in the last six months. Excluding defense, new orders decreased 0.7%. Excluding transportation, new orders increased 0.4%. Core capital goods orders, excluding defense and aircraft, advanced 0.9% in August following a 0.4% decline in July.
Imports and exports: August saw both import and export prices increase for the second straight month. Import prices rose 0.5% following a 0.1% increase in July. The August increase in import prices was the third monthly advance of 2023. Imports declined 3.0% over the past year. Import fuel prices rose 6.7% in August, driven higher by production cuts. Nonfuel import prices edged down 0.1%. Export prices rose 1.3% in August after rising 0.5% in the previous month. The advance in August was the largest monthly increase since a 2.7% increase in May 2022. Higher nonagricultural prices in August more than offset lower agricultural prices. Despite the advance in August, export prices declined 5.5% over the past year.
The international trade in goods deficit decreased $6.6 billion, or 7.3%, in August. Exports of goods increased 2.2% from July, while imports of goods decreased 1.2%.
The latest information on international trade in goods and services, released September 6, was for July and revealed that the goods and services trade deficit increased $65.0 billion, or 2.0%, from June. Exports for July rose 1.6% from the previous month. Imports increased 1.7%. Year to date, the goods and services deficit decreased $128.3 billion, or 21.4%, from the same period in 2022. Exports increased 1.6%, while imports decreased 4.3%.
International markets: Russia’s economy is expected to grow. Despite Western sanctions against Russia in response to the invasion of Ukraine, including a price cap on its oil exports, Moscow has apparently been able to offset that cap by increasing oil prices and exporting to new markets. Elsewhere, after 14 consecutive monthly increases, the Bank of England decided to leave the Bank Rate at its current 5.25%, counter to the anticipated 25.0-basis point increase that was widely expected. Price inflation remained steady in Japan as higher food and gasoline prices offset decreases in utilities. Japan’s Consumer Price Index rose 2.8% for the 12 months ended in September, a decrease of 0.1 percentage point from the August annual figure. China saw industrial profits fall 11.7% for the year ended in August, which was an upgrade from the 15.5% decline for the year ended in July. This is in line with China’s industrial production, which rose 4.5% for the year ended in August, higher than the 3.7% estimate for the year ended in July. Overall, China saw its economy stall somewhat in September with retail sales, pricing power, and loan growth weaker compared to August. For September, the STOXX Europe 600 Index decreased 0.9%; the United Kingdom’s FTSE rose 2.5%; Japan’s Nikkei 225 Index fell 2.6%; and China’s Shanghai Composite Index dipped 0.3%.
Consumer confidence: Consumer confidence declined in September for the second straight month. The Conference Board Consumer Confidence Index® decreased in September to 103.0, down from 108.7 in August (revised). The Present Situation Index, based on consumers’ assessment of current business and labor market conditions, rose marginally to 147.1 in September, up from 146.7 in the previous month. The Expectations Index, based on consumers’ short-term outlook for income, business, and labor market conditions, declined to 73.7 in September from 83.3 in August.
Eye on the Month Ahead
It appeared that the start of the fourth quarter might be marred by a government shutdown. However, U.S. lawmakers reached a short-term resolution right before the October 1 deadline. October will begin with autoworkers on strike and student loan payments resuming after a pandemic-related pause. Otherwise, investors will continue to focus on inflation data and the Federal Reserve’s response during the last three months of the year. Concerns over slowing economic activity, both here and globally, also will influence the market going forward.
Data sources: Economic: Based on data from U.S. Bureau of Labor Statistics (unemployment, inflation); U.S. Department of Commerce (GDP, corporate profits, retail sales, housing); S&P/Case-Shiller 20-City Composite Index (home prices); Institute for Supply Management (manufacturing/services). Performance: Based on data reported in WSJ Market Data Center (indexes); U.S. Treasury (Treasury yields); U.S. Energy Information Administration/Bloomberg.com Market Data (oil spot price, WTI Cushing, OK); www.goldprice.org (spot gold/silver); Oanda/FX Street (currency exchange rates). News items are based on reports from multiple commonly available international news sources (i.e., wire services) and are independently verified when necessary with secondary sources such as government agencies, corporate press releases, or trade organizations. All information is based on sources deemed reliable, but no warranty or guarantee is made as to its accuracy or completeness. Neither the information nor any opinion expressed herein constitutes a solicitation for the purchase or sale of any securities, and should not be relied on as financial advice. Forecasts are based on current conditions, subject to change, and may not come to pass. U.S. Treasury securities are guaranteed by the federal government as to the timely payment of principal and interest. The principal value of Treasury securities and other bonds fluctuates with market conditions. Bonds are subject to inflation, interest-rate, and credit risks. As interest rates rise, bond prices typically fall. A bond sold or redeemed prior to maturity may be subject to loss. Past performance is no guarantee of future results. All investing involves risk, including the potential loss of principal, and there can be no guarantee that any investing strategy will be successful.
The Dow Jones Industrial Average (DJIA) is a price-weighted index composed of 30 widely traded blue-chip U.S. common stocks. The S&P 500 is a market-cap weighted index composed of the common stocks of 500 largest, publicly traded companies in leading industries of the U.S. economy. The NASDAQ Composite Index is a market-value weighted index of all common stocks listed on the NASDAQ stock exchange. The Russell 2000 is a market-cap weighted index composed of 2,000 U.S. small-cap common stocks. The Global Dow is an equally weighted index of 150 widely traded blue-chip common stocks worldwide. The U.S. Dollar Index is a geometrically weighted index of the value of the U.S. dollar relative to six foreign currencies. Market indexes listed are unmanaged and are not available for direct investment.
IRS Circular 230 disclosure: To ensure compliance with requirements imposed by the IRS, we inform you that any tax advice contained in this communication (including any attachments) was not intended or written to be used, and cannot be used, for the purpose of (i) avoiding tax-related penalties under the Internal Revenue Code or (ii) promoting, marketing or recommending to another party any matter addressed herein.
Securities offered through Emerson Equity LLC, member FINRA and SIPC. Financial Planning, Wealth Management and Tax Services offered through EagleStone Tax & Wealth Advisors, Inc. Emerson Equity and EagleStone are not affiliated entities. Please review Emerson Equity LLC’s Form CRS for additional information regarding their services.
Financial Planning, Investment and Wealth Management services provided through EagleStone Wealth Advisors, Inc. Tax and Accounting services provided through EagleStone Tax & Accounting Services.