EagleStone Wealth Advisors, Inc. is in the process of withdrawing its registration with the SEC and is no longer taking on any new clients. EagleStone Tax & Wealth Advisors has merged with Onyx Bridge Wealth Group, Onyx Bridge Tax Group, and Onyx Bridge Retirement Group, respectively. You will be redirected to their site in the next 5 seconds.
The Markets (third quarter through September 30, 2022)
The ramifications of stamping down rising inflation dominated the markets in the third quarter. Investors weighed the balance between an aggressive government policy aimed at curbing price pressures against the possibility of those very policies leading to an economic recession. That dichotomy was not lost on Federal Reserve officials, who stoically made clear that “a sustained period of below trend growth” may be a necessary byproduct as part of the effort to bring down inflation. Ultimately, investors moved away from risk, sending stocks lower for the third straight quarter of 2022, while putting an exclamation point on the worst decline in the first nine months of a year in 20 years. By the end of the quarter, the Dow, the S&P 500, and the Nasdaq had entered into bear market territory. All three benchmark indexes are down at least 21.0% on the year. Crude oil prices declined sharply in the quarter for several reasons, including waning fuel demand, China’s ongoing COVID lockdown policy, the unexpectedly benign impact of sanctions against Russian oil exports, rising inflation, and the strength of the U.S. dollar. The strength of the dollar often weighs on oil and other commodities that are priced in that currency, making them more expensive to purchasers using other currencies. Bond prices declined during the quarter, pushing yields up. The 10-year Treasury yield jumped 83 basis points since the end of June and nearly 230 basis points on the year. Gold prices struggled to maintain any momentum, ultimately falling more than 7.50% in the quarter.
Wall Street rebounded in July as investors saw a glimmer of hope that inflationary pressures were easing. An increase in consumer discretionary shares helped drive the S&P 500 up over 9.0%, the best monthly gain since the end of 2021. The Nasdaq led the benchmark indexes listed here, climbing 12.4%, followed by the Russell 2000, which rose 10.4%. The Dow added 6.7%, while the Global Dow gained 3.8%. Long-term bond prices advanced, driving bond yields lower. Ten-year Treasury yields fell 33 basis points to close the month at 2.64%, their lowest level in nearly four months. Crude oil prices slid over 7.0% to $98.23 per barrel, while prices at the pump fell on waning demand. The dollar continued to strengthen, while gold prices lost more than 1.5%. The Federal Reserve hiked interest rates 75 basis points, despite several inflationary indicators showing a slowdown in price pressures. The second estimate of the second-quarter gross domestic product showed the economy retracted by 0.6%. While industrial production rose 0.5%, durable goods orders slid 0.1%. The housing sector retracted, impacted by rising mortgage interest rates, as both existing home sales (-5.7%) and sales of new single-family homes (-9.4%) declined.
August saw stock markets give back July gains, as investors grew increasingly worried that the economy was headed toward a recession. Large-cap stocks were hit particularly hard, pulling the major benchmark indexes lower. The Nasdaq, the Dow, and the S&P 500 lost more than 4.0%. The small caps of the Russell 2000 performed best, despite closing down 2.2%. Long-term bond yields jumped higher as prices slid. The yield on 10-year Treasuries rose nearly 50 basis points to 3.13%. Crude oil and gas prices continued to fall. The dollar rose nearly 3.0% against a basket of global currencies. Gold prices declined more than 3.0%. After adding over 500,000 new jobs in July, the labor sector continued to advance, albeit at a slower pace, with the addition of 315,000 new jobs. Although the Federal Open Market Committee did not meet in August, Fed Chair Jerome Powell’s comments at the Jackson Hole gathering were definitely hawkish, confirming the Committee’s stance that inflation had to be tamed, despite some economic hardship. Adding fuel to the fire, inflationary indicators in August showed prices reversed course from the month earlier. The Consumer Price Index rose 0.1%, while the personal consumption expenditures price index rose 0.3%.
Stocks soured in September as investors worried about an impending economic recession, despite an uptick in consumer spending (personal consumption expenditures), which accounts for nearly 70% of economic activity. The Federal Reserve increased the target range for the federal funds rate 75 basis points, while anticipating ongoing increases in the target range will be appropriate. Despite a surge in stock values early in the month, each of the benchmark indexes ended September in the red. Crude oil prices fell in September for the fourth consecutive month. The yield on 10-year Treasuries rose by 67 basis points. The dollar advanced, while gold prices slid lower.
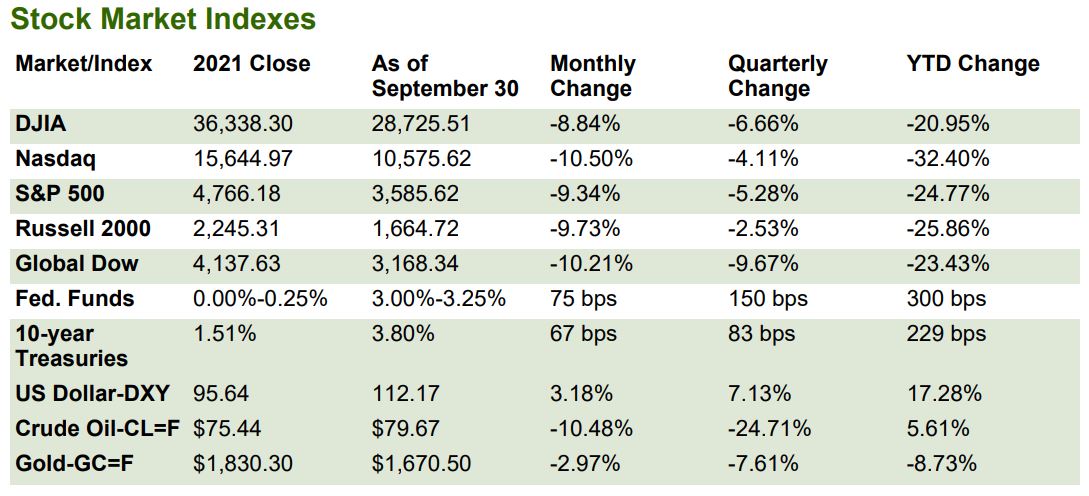
Chart reflects price changes, not total return. Because it does not include dividends or splits, it should not be used to benchmark performance of specific investments.
Latest Economic Reports
- Employment: Employment rose by 315,000 in August, better than expected but well below the revised July total of 526,000. Employment has risen by 5.8 million over the past 12 months, as the labor market continued to recover from the job losses of the pandemic-induced recession. This growth brings total employment 240,000 higher than its pre-pandemic level in February 2020. In August, job gains occurred in professional and business services, retail trade, and health care. The unemployment rate edged up to 3.7% in August (3.5% in July), and the number of unemployed persons increased by 344,000 to 6.0 million, with both measures returning to their pre-pandemic levels. Among the unemployed, the number of workers who permanently lost their jobs increased by 188,000 to 1.4 million in August. Among that group, the number of persons who were unable to work because their employer closed or lost business due to the pandemic fell to 1.9 million, down from 2.2 million in July. The labor force participation rate increased by 0.3 percentage point to 62.4% in August. The employment-population ratio in August, at 60.1%, little changed from the previous month. Both measures remain below their February 2020 values (63.4% and 61.2%, respectively). In August, average hourly earnings rose by $0.10 to $32.36. Over the 12 months ended in August, average hourly earnings increased by 5.2%. The average work week was 34.5 hours in August, a decrease of 0.1 hour from July.
- There were 193,000 initial claims for unemployment insurance for the week ended September 24, while the total number of insured unemployment claims was 1,347,000 as of September 17. A year ago, there were 396,000 initial claims for unemployment insurance and 2,720,000 total insured unemployment claims.
- FOMC/interest rates: The Federal Open Market Committee increased the federal funds target rate range 75 basis points following its meeting in September. With the latest increase, the FOMC has increased interest rates by 300 basis points since January. In its statement following the September meeting, the Committee expects inflation will continue to run higher for the foreseeable future. The FOMC projects interest rates will increase another 125 basis points for the remainder of 2022.
- GDP/budget: The economy has decelerated for two quarters in a row. Gross domestic product decreased 0.6% in the second quarter of 2022 after falling 1.6% in the first quarter. The decrease in GDP reflected downturns in private inventory investment, residential fixed investment, federal government spending, and state and local government spending that were partly offset by increases in exports and consumer spending. Imports, which are a subtraction in the calculation of GDP. increased. Consumer spending rose 2.0% in the second quarter after increasing 1.3% in the first quarter. Most of the increase in consumer spending is attributable to a 4.6% jump in services, while spending on durables slid 2.8%. Also dragging down GDP was a 5.0% decline in fixed investment, within which residential fixed investment dropped 17.8%, evidence of the slowdown in the housing sector. Nonresidential (business) fixed investment inched up 0.1% in the second quarter after rising 7.9% in the previous quarter. Exports rose 13.8% in the second quarter, while imports, which are a negative in the calculation of GDP, advanced 2.2% after jumping 18.4% in the first quarter. In the second quarter, the personal consumption expenditures price index, a measure of inflation, increased 7.3%.
- The Treasury budget deficit came in at $219.6 billion in August, up from $211.1 billion in July and over the August 2021 deficit of $170.6 billion. With only one month remaining in fiscal year 2022, the deficit through August sits at $945.7 billion, $1,764.9 billion lower than the deficit over the same period in fiscal year 2021, as outlays dropped $942.9 billion while receipts increased $822.0 billion. So far in this fiscal year, individual income tax receipts have risen $574.8 million, and corporate income tax receipts have increased $33.8 million.
- Inflation/consumer spending: While inflationary pressures appeared to wane in July, data for August revealed prices reversed course and moved upward. The personal consumption expenditures price index, a preferred inflation indicator of the Federal Reserve, advanced 0.3% in August after retreating 0.1% the previous month. For the year ended in August, prices have increased 6.2%. Prices less the volatile food and energy increased 0.6% in August and 4.9% since August 2021. In addition, personal income increased 0.3% in August, the same increase as in July. Wages and salaries rose 0.3% in August after jumping 0.8% higher in July. Disposable (after-tax) personal income advanced 0.4% in August following a 0.3% bump higher in July. Consumer spending, as measured by the personal consumption expenditures index, increased 0.4% after decreasing 0.2% in July. Driving the increase in the PCE index was a 0.8% rise in consumer spending on services. Spending on goods actually fell 0.5% in August following a 0.7% decline in July.
- The Consumer Price Index rose 0.1% in August, unchanged from the previous month. For the 12 months ended in August, the CPI increased 8.3% (8.5% for the 12-month period ended in July). Both the monthly and 12-month rates were above expectations. In August, the CPI less food and energy rose 0.6% after increasing 0.3% in July. Increases in prices for shelter, medical care, household furnishings and operations, new vehicles, motor vehicle insurance, and education were several of the many contributors to the broad-based monthly CPI increase. These increases were mostly offset by a 10.6% decline in the gasoline prices. Food prices continued to rise, increasing 0.8% in August as food at home prices rose 0.7%. In August, the CPI less food and energy climbed 0.6% and advanced 6.3% year over year.
- Prices that producers receive for goods and services dipped 0.1% in August following a 0.4% decline in July. Despite the recent downturn, producer prices have increased 8.7% since August 2021 (9.8% for the 12 months ended in July). Prices less foods, energy, and trade services increased 0.2% in August and 5.6% for the 12 months ended in August. The August decrease in the producer price index was attributable to a 1.2% decline in prices for goods, after falling 1.7% in July. In contrast, prices for services advanced 0.4% in August. Three-quarters of the decrease in prices for goods was attributable to a 12.7% decrease in gasoline prices.
- Housing: Sales of existing homes retreated for the seventh consecutive month in August, falling 0.4% from the July estimate. Year over year, existing home sales were 19.9% under the August 2021 total. According to the latest survey from the National Association of Realtors®, rising mortgage rates have impacted sales. In addition, inventory remains tight as homeowners are reluctant to sell after locking in historically low mortgage rates in recent years. The median existing-home price was $389,500 in August, down from $399,200 in July but 7.7% higher than August 2021 ($361,500). Unsold inventory of existing homes represents a 3.2-month supply at the current sales pace, unchanged from July. Sales of existing single-family homes also fell, down 0.9% in August. Sales of existing single-family homes have fallen 19.2% since August 2021. The median existing single-family home price was $396,300 in August, down from $405,800 in July but 7.6% over the August 2021 price.
- Sales of new single-family homes soared in August, increasing 28.8% from July’s total but 0.1% below the August 2021 estimate. Although mortgage interest rates increased in August, the price of homes sold decreased, helping drive sales. The median sales price of new single-family houses sold in August was $436,800 ($466,300 in July). The August average sales price was $521,800 ($556,700 in July). The inventory of new single-family homes for sale in August represents a supply of 8.5 months at the current sales pace, down from July’s 10.6-month supply.
- Manufacturing: Industrial production slipped 0.2% in August after advancing 0.5% in July. The decrease in industrial production can be traced to a 2.3% drop in utilities output and a flat reading for mining. In August, manufacturing output gained 0.1% after increasing 0.6% in the previous month. In August, production gains of at least 1.0% were recorded by machinery, by computer and electronic products, by aerospace and miscellaneous transportation equipment, and by miscellaneous manufacturing. Overall, total industrial production in August was 3.7% higher than it was a year earlier. Since August 2021, manufacturing has risen 3.3%, mining has jumped 8.4%, while utilities have decreased 1.6%.
- August saw new orders for durable goods decrease 0.2% after falling 0.1% in July. Excluding transportation, new orders rose 0.2% in August. Excluding defense, new orders decreased 0.9%. Transportation equipment drove the August decline, falling 1.1% after decreasing 0.7% in July. New orders for capital goods slid 0.8% in August after increasing 3.9% the previous month.
- Imports and exports: Import prices declined 1.0% in August following a 1.5% decrease in July, according to the U.S. Bureau of Labor Statistics. The August decrease marks the first time import prices have decreased in consecutive months since February, March, and April 2020. Prices for imports advanced 7.8% for the year ended in August, the smallest 12-month increase since the index rose 7.1% from March 2020 to March 2021. In August, lower fuel and nonfuel prices contributed to the monthly decrease. Fuel import prices fell 6.8% in August following a 7.5% decrease the previous month. Despite the August decline, import fuel prices advanced 48.5% over the past year. Prices for nonfuel imports declined for the fourth consecutive month, dipping 0.2% in August. Prices for U.S. exports fell 1.6% in August following a 3.7% drop the previous month. Lower agricultural and nonagricultural prices contributed to the August decline. Prices for exports have risen 10.8% since August 2021.
- The international trade in goods deficit was $87.3 billion in August, down 3.2% from July. Exports of goods were $179.8 billion in August, $1.7 billion less than in July. Imports of goods were $267.1 billion in August, $4.6 billion less than July imports.
- The latest information on international trade in goods and services, released September 7, is for July and shows that the goods and services trade deficit narrowed by 12.6%, to $70.6 billion from the June deficit. July exports were $0.5 billion more than June exports. July imports were $9.7 billion lower than June imports. Year over year, the goods and services deficit increased $136.6 billion, or 29.0%, from the same period in 2021. Exports increased 19.0%, while imports increased 22.1%.
- International markets: The global fight against rising inflation apparently has a long way to go, and economies are beginning to feel the impact. The Bank of England, undeterred by the prospects of an economic recession, tightened its monetary policy further in September, hiking the bank rate 50 basis points to 2.25%, equaling the August rate hike, which marked the first time in 27 years that the bank rate had been increased by more than 25 basis points. Stocks reacted poorly to comments from the BOE, following a pledge to proceed with planned tax cuts while continuing to raise interest rates. With these moves, the BOE has revised the near-term outlook for inflation from 13.3% in October to nearly 11.0%. In addition, the British government announced the introduction of an energy-price guarantee that will cap household energy costs for the next two years. Nevertheless, the eurozone’s annual rate of inflation hit 10.0% in September, the highest growth rate in prices since 1997. The war in Ukraine took another turn following Russian President Vladimir Putin’s move to annex portions of eastern Ukraine, further adding to stock market concerns. In China, weakening manufacturing and a slowdown in the property sector prompted the People’s Bank of China to relax its monetary policy in diverging from the policy tightening at other central banks. Overall for the markets in September, the STOXX Europe 600 Index slid 6.6%. The United Kingdom’s FTSE fell roughly 5.1%. Japan’s Nikkei 225 Index plunged 6.2%, while China’s Shanghai Composite Index lost 5.1%.
- Consumer confidence: The Conference Board Consumer Confidence Index® increased in September for the second consecutive month. The September index stands at 108.0, up from 103.6 in August. The Present Situation Index, based on consumers’ assessment of current business and labor market conditions, improved to 149.6 in September, up from 145.3 in August. The Expectations Index, based on consumers’ short-term outlook for income, business, and labor market conditions, rose to 80.3 in September (75.8 in August).
Eye on the Quarter Ahead
The fourth quarter is expected to continue the trends from the previous three months. Inflationary pressures are likely to slow as the Federal Reserve continues its aggressive policies until inflation settles at the target 2.0% rate. The market will probably continue exhibiting roller coaster turbulence in response to the Fed’smoves. Employment should remain strong, although rising mortgage interest rates will almost certainly impede the housing sector. As we enter the final three months of 2022, questions remain as to the direction of the war in Ukraine, oil and gasoline prices, and whether the economy will remain relatively positive or head toward a recession.
Data sources: Economic: Based on data from U.S. Bureau of Labor Statistics (unemployment, inflation); U.S. Department of Commerce (GDP, corporate profits, retail sales, housing); S&P/Case-Shiller 20-City Composite Index (home prices); Institute for Supply Management (manufacturing/services). Performance: Based on data reported in WSJ Market Data Center (indexes); U.S. Treasury (Treasury yields); U.S. Energy Information Administration/Bloomberg.com Market Data (oil spot price, WTI Cushing, OK); www.goldprice.org (spot gold/silver); Oanda/FX Street (currency exchange rates). News items are based on reports from multiple commonly available international news sources (i.e., wire services) and are independently verified when necessary with secondary sources such as government agencies, corporate press releases, or trade organizations. All information is based on sources deemed reliable, but no warranty or guarantee is made as to its accuracy or completeness. Neither the information nor any opinion expressed herein constitutes a solicitation for the purchase or sale of any securities, and should not be relied on as financial advice. Forecasts are based on current conditions, subject to change, and may not come to pass. U.S. Treasury securities are guaranteed by the federal government as to the timely payment of principal and interest. The principal value of Treasury securities and other bonds fluctuates with market conditions. Bonds are subject to inflation, interest-rate, and credit risks. As interest rates rise, bond prices typically fall. A bond sold or redeemed prior to maturity may be subject to loss. Past performance is no guarantee of future results. All investing involves risk, including the potential loss of principal, and there can be no guarantee that any investing strategy will be successful.
The Dow Jones Industrial Average (DJIA) is a price-weighted index composed of 30 widely traded blue-chip U.S. common stocks. The S&P 500 is a market-cap weighted index composed of the common stocks of 500 largest, publicly traded companies in leading industries of the U.S. economy. The NASDAQ Composite Index is a market-value weighted index of all common stocks listed on the NASDAQ stock exchange. The Russell 2000 is a market-cap weighted index composed of 2,000 U.S. small-cap common stocks. The Global Dow is an equally weighted index of 150 widely traded blue-chip common stocks worldwide. The U.S. Dollar Index is a geometrically weighted index of the value of the U.S. dollar relative to six foreign currencies. Market indexes listed are unmanaged and are not available for direct investment.
IRS Circular 230 disclosure: To ensure compliance with requirements imposed by the IRS, we inform you that any tax advice contained in this communication (including any attachments) was not intended or written to be used, and cannot be used, for the purpose of (i) avoiding tax-related penalties under the Internal Revenue Code or (ii) promoting, marketing or recommending to another party any matter addressed herein.
Securities offered through DAI Securities, LLC, Member FINRA/SIPC. Financial Planning, Wealth Management and Tax Services offered through EagleStone Tax & Wealth. DAI Securities and EagleStone are not affiliated entities.
Financial Planning, Investment & Wealth Management services provided through EagleStone Wealth Advisors, Inc. Tax & Accounting services provided through EagleStone Tax & Accounting Services.