EagleStone Wealth Advisors, Inc. is in the process of withdrawing its registration with the SEC and is no longer taking on any new clients. EagleStone Tax & Wealth Advisors has merged with Onyx Bridge Wealth Group, Onyx Bridge Tax Group, and Onyx Bridge Retirement Group, respectively. You will be redirected to their site in the next 5 seconds.
Do You Know If Your Retirement Is at Risk?

An analysis of data from the Federal Reserve Survey of Consumer Finances found that 47% of U.S. households were at risk of not having adequate retirement income, but only 19% were aware of their risk. On the other hand, 53% were not at risk, but only 38% knew it. This means that more than four out of 10 households were either too worried about their retirement readiness or not worried enough. It may be surprising that lower-income households were more likely to be too worried, while higher-income households were more likely to be not worried enough.
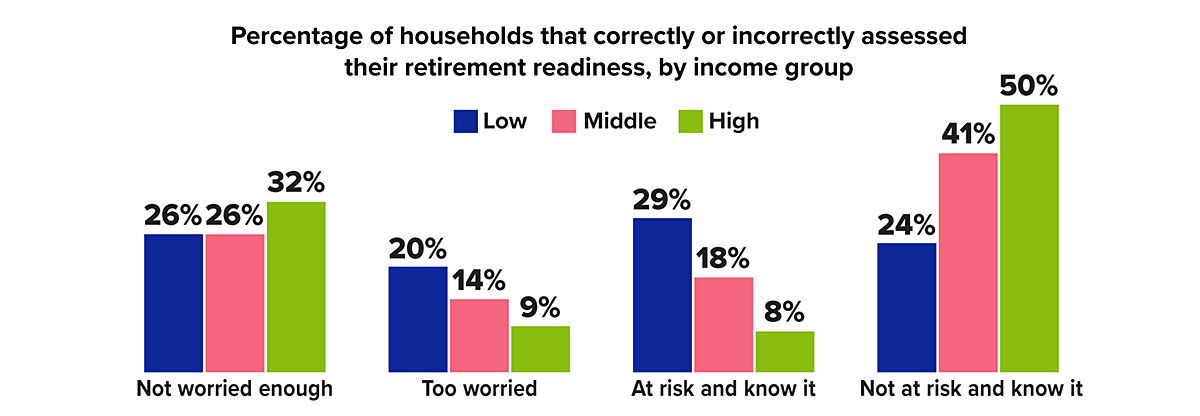
Source: Pew Research Center, 2023 (survey did not include workers with unlimited paid time off)
Market Measures: Beyond the Dow

When you hear or read that the market is up or down, what does that really mean? More often than not, it reflects movement in the two best-known stock market indexes, the Dow Jones Industrial Average and the S&P 500.
In fact, there are hundreds of indexes that track various categories of investments. While you cannot invest directly in an index, you can buy funds that track specific indexes, and you can look at indexes as a benchmark for certain portions of your portfolio. For example, the Dow or the S&P 500 might be a reasonable benchmark for your domestic stocks and stock funds, but you should not expect your entire portfolio to match the performance of those indexes.
Here are some commonly cited indexes.
The Dow Jones Industrial Average tracks stocks of 30 large well-known U.S. companies across a variety of business sectors. Originally a true average of stock prices, it now uses a divisor to adjust for stock splits, distributions, and substitutions — making it a price-weighted index rather than a true average.1
Unlike the Dow, the following indexes are weighted based on market capitalization, the value of a stock’s outstanding shares. Market-cap-weighted indexes are skewed toward the performance of the larger companies in the index.
The S&P 500 tracks a much broader range of large U.S. companies (large caps) than the Dow and is often considered representative of the U.S. stock market in general. However, it does not capture mid-size companies (mid caps) or small companies (small caps), which generally carry higher risk and higher growth potential than large companies and are tracked by the S&P MidCap 400 and S&P SmallCap 600, respectively. Together these three indexes comprise the S&P Composite 1500. The number of stocks in S&P indexes may vary slightly from the number indicated in the name.2
The NASDAQ Composite Index tracks all domestic and foreign stocks traded on the Nasdaq Stock Market (about 3,400 in early 2024). It includes companies of all sizes across a range of industries but is heavily weighted toward technology companies. Many Nasdaq stocks carry higher growth potential but greater risk than the large domestic stocks tracked by the Dow and the S&P 500. The Nasdaq-100 tracks the largest non-financial companies traded on the Nasdaq.3
The Russell 3000 Index tracks stocks of the 3,000 largest U.S. companies, ranked by market capitalization. The Russell 1000 Index tracks about 1,000 of the largest, essentially a combination of large caps and mid caps. The Russell 2000 Index tracks the rest and is the most widely used benchmark for U.S. small-cap stocks.4
The FT Wilshire 5000 Index tracks the performance of all U.S. stocks with readily available price data, making it the broadest measure of the U.S. stock market. When established in 1974, the index contained around 4,700 stocks, and grew to more than 7,500 in 1998. The number has dropped since then, largely due to corporate consolidation, and the index included about 3,400 stocks in early 2024.5
The MSCI EAFE Index tracks about 800 large- and mid-cap stocks in 21 developed countries outside the United States and Canada and is a widely accepted benchmark for foreign stocks. The MSCI World Index includes the same 21 countries plus the U.S. and Canada and is heavily weighted toward U.S. stocks.6
Five Indexes, Five Years
Annual Index performance (price only), 2019 to 2023
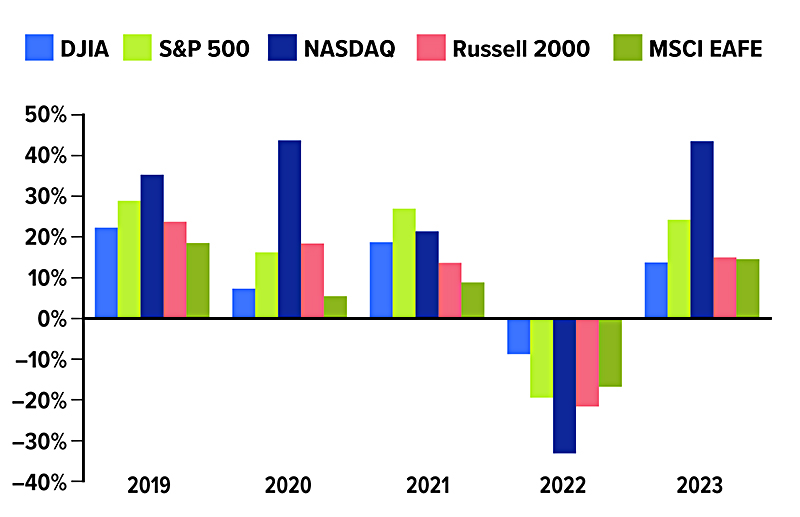
Source: London Stock Echange Group, 2024, for the period 12/31/2018 to 12/31/2023. Dow Jones Industrial Average (DJIA) Price Index, S&P 500 Composite Price Index, NASDAQ Composite Index (price). Russell 2000 Price Index, and MSCI EAFE Price Index. The performance of an unmanaged index is not indicative of the performance of any specific security. Past performance is no guarantee of future results. Actual results will vary.
All investing involves risk, including the possible loss of principal, and there is no guarantee that any investment strategy will be successful. Investing internationally carries additional risks such as differences in financial reporting and currency exchange risk, as well as economic and political risk unique to the specific country. This may result in greater share price volatility.
Funds are sold by prospectus. Please consider the investment objectives, risks, charges, and expenses carefully before investing. The prospectus, which contains this and other information about the investment company, can be obtained from your financial professional. Be sure to read the prospectus carefully before deciding whether to invest.
1–2) S&P Dow Jones Indices, 2024; 3) Nasdaq, 2024; 4) FTSE Russell, 2024; 5) Wilshire, 2024; 6) MSCI, 2024
Housing Market Trends: Are They Helping or Hurting the Economy?

In an unusual twist, U.S. home values climbed to an annual record of $389,800 in 2023, even as mortgage rates rose to the highest levels in a generation. The median price of existing homes rose 4.4% for the twelve months ended in December 2023 to reach $382,600. (Buying activity and prices tend to peak during the summer and tick back down when the market slows later in the year.)1
Near the end of October 2023, the average rate for a 30-year fixed mortgage climbed to a 23-year high of nearly 8%, before retreating a bit.2 But despite sky-high borrowing costs, buyer demand exceeded the supply of homes for sale.
As a result, sellers generally fared well, but 2023 was a challenging year for would-be homebuyers.
A market in limbo
Rising mortgage rates and home prices made it harder to afford a home, causing many buyers to be priced out of their favorite neighborhoods and forcing others out of the market altogether. In August 2023, housing affordability dropped to its worst levels since 1985.3
Many people who already own homes have been reluctant to sell and move because they would have to finance their next homes at much higher rates than they currently pay — a conundrum that has worsened the inventory shortage.
This persistent lack of inventory combined with low affordability has cut deeply into home sales. For all of 2023, existing home sales fell to the lowest level in nearly 30 years (4.09 million).4 An estimated 668,000 new homes were sold in 2023, an increase of 4.2% from the previous year, but new construction accounts for less than 15% of the total market.5
Housing and GDP
Housing contributes directly to the nation’s gross domestic product (GDP) in two ways: spending on housing services and residential fixed investment. Housing services include rental payments, imputed rent (the estimated rental value of owner-occupied homes), and utility payments. Residential fixed investment includes new home construction, residential remodeling, production of manufactured homes, and brokers’ fees. In the fourth quarter of 2023, housing accounted for $4.4 trillion of U.S. GDP on a seasonally adjusted annual basis or 15.9% (12.0% for housing services and 3.9% for fixed residential investment).6
New home construction stimulates local economies by creating higher-wage jobs and boosting property tax receipts. Nationally (and locally), it benefits other types of businesses as well, by spurring production and hiring in industries that provide raw materials like lumber or that manufacture or sell building tools, equipment, and home components such as windows, cabinets, appliances, and flooring. That’s why the Census Bureau’s report on housing starts, which were up 7.6% from the previous year’s level in December 2023, is considered a leading economic indicator. 7
Consumers are the key
The health of the housing market can also affect economic activity in other industries indirectly. For example, the “wealth effect” refers to how shifts in home prices, up or down, can influence consumer finances, confidence, and behavior. When home values and equity are rising, consumers who own homes tend to feel wealthier and may be more comfortable spending their money.
The “transaction effect” describes the increase in consumer spending that typically occurs when people move into new homes, which tends to generate demand for goods and services such as appliances, furniture, electronics, home improvement, and landscaping. On the other hand, extremely low affordability might influence younger consumers in a different way. When buying a home seems unattainable, it may cause them to give up on saving for that goal and shift to spending on other things.
Home Building Stages a Recovery
In Q3 2023, fixed residential investment added to U.S. GDP for the first time since Q1 2021. But in Q4, an increase in new residential structures was mostly offset by a decrease in broker’s fees.
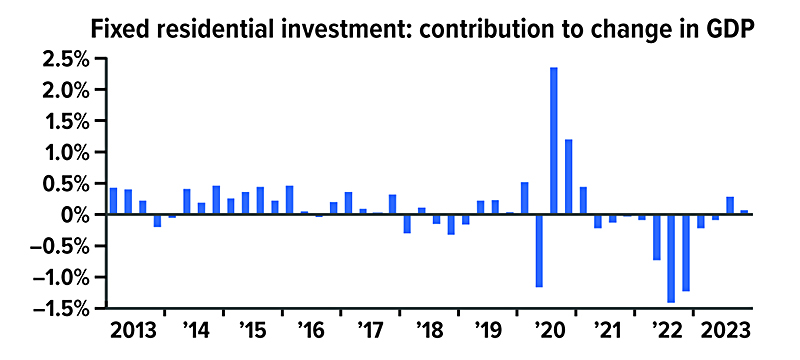
Source: U.S. Bureau of Economic Analysis, 2024
Given housing’s importance to the economy, there is some concern that a prolonged period of high rates could continue to constrain home building and sales, cause home prices to fall, and damage consumer confidence. When the Federal Reserve begins to cut interest rates, mortgages should gradually follow suit, but that’s not likely to happen until GDP growth slows and inflation is no longer seen as the larger threat.
1, 4) National Association of Realtors, 2024; 2) Freddie Mac, 2023; 3) National Association of Realtors via Haver Analytics, 2023; 5, 7) U.S. Census Bureau, 2024; 6) U.S. Bureau of Economic Analysis, 2024
Are You Spending Money to Keep Stuff You Don't Need?

It’s estimated that more than one in 10 Americans leases a storage unit. In June 2023, the nationwide prices charged by self-storage facilities averaged $165 per month, after rising 20% over the previous year.1 Storage renters may pay more than that for large spaces or climate-controlled units, and at facilities in high-cost cities such as Los Angeles and New York.2
If you keep excess belongings stored away from home and well out of sight, this recurring monthly expense may not stay top of mind. However, finding the motivation to empty a storage space could create breathing room in your household budget and/or yield savings over time that helps you make progress toward important financial goals.
For example, if you were to invest that $165 per month in a college savings or retirement account, the balance could grow to $28,559 in 10 years or to $85,953 in 20 years (assuming a hypothetical 7% annual rate of return).
Reasons for renting storage space

Source: StorageCafe.com, April 25, 2023 (does not equal 100% due to rounding)
This hypothetical example of mathematical principles is used for illustrative purposes only and does not represent the performance of any specific investment. Fees, expenses, and taxes are not considered and would reduce the performance shown if they were included. Actual results will vary. Rates of return will vary over time, particularly for long-term investments.
Clearing space at home
It may not be your favorite way to spend a weekend but decluttering your closets, garage, and living spaces would be a good place to start. Prioritize and make room for the possessions and keepsakes you love most but resolve to let go of things that may not be worth keeping, especially if you must pay for storage indefinitely.
Try to sell furnishings, housewares, toys, or clothing that you don’t use regularly for some extra cash by posting ads with photos on resale apps, websites, or social media, or possibly by having a yard sale. If you can’t sell certain items, you can feel good about giving them away to friends, neighbors, or a local charity.
1) The Wall Street Journal, August 26, 2023
2) StorageCafe.com, April 25, 2023
2) StorageCafe.com, April 25, 2023
IRS Circular 230 disclosure: To ensure compliance with requirements imposed by the IRS, we inform you that any tax advice contained in this communication (including any attachments) was not intended or written to be used, and cannot be used, for the purpose of (i) avoiding tax-related penalties under the Internal Revenue Code or (ii) promoting, marketing or recommending to another party any matter addressed herein.
Securities offered through Emerson Equity LLC. Member FINRA/SIPC. Advisory Services offered through EagleStone Tax & Wealth Advisors. EagleStone Tax & Wealth Advisors is not affiliated with Emerson Equity LLC. Financial Planning, Investment and Wealth Management services provided through EagleStone Wealth Advisors, Inc. Tax and Accounting services provided through EagleStone Tax & Accounting Services.
For more information on Emerson Equity, visit FINRA’s BrokerCheck website or download a copy of Emerson Equity’s Customer Relationship Summary.